
After OS patching and reboot of a physical server used for Icinga2 monitoring, the Icinga 2 services did not work as expected. Well, actually they did - sort of.
After the physical server, on which Icinga2 runs, was rebooted, the Icingaweb2 UI showed the following error message:
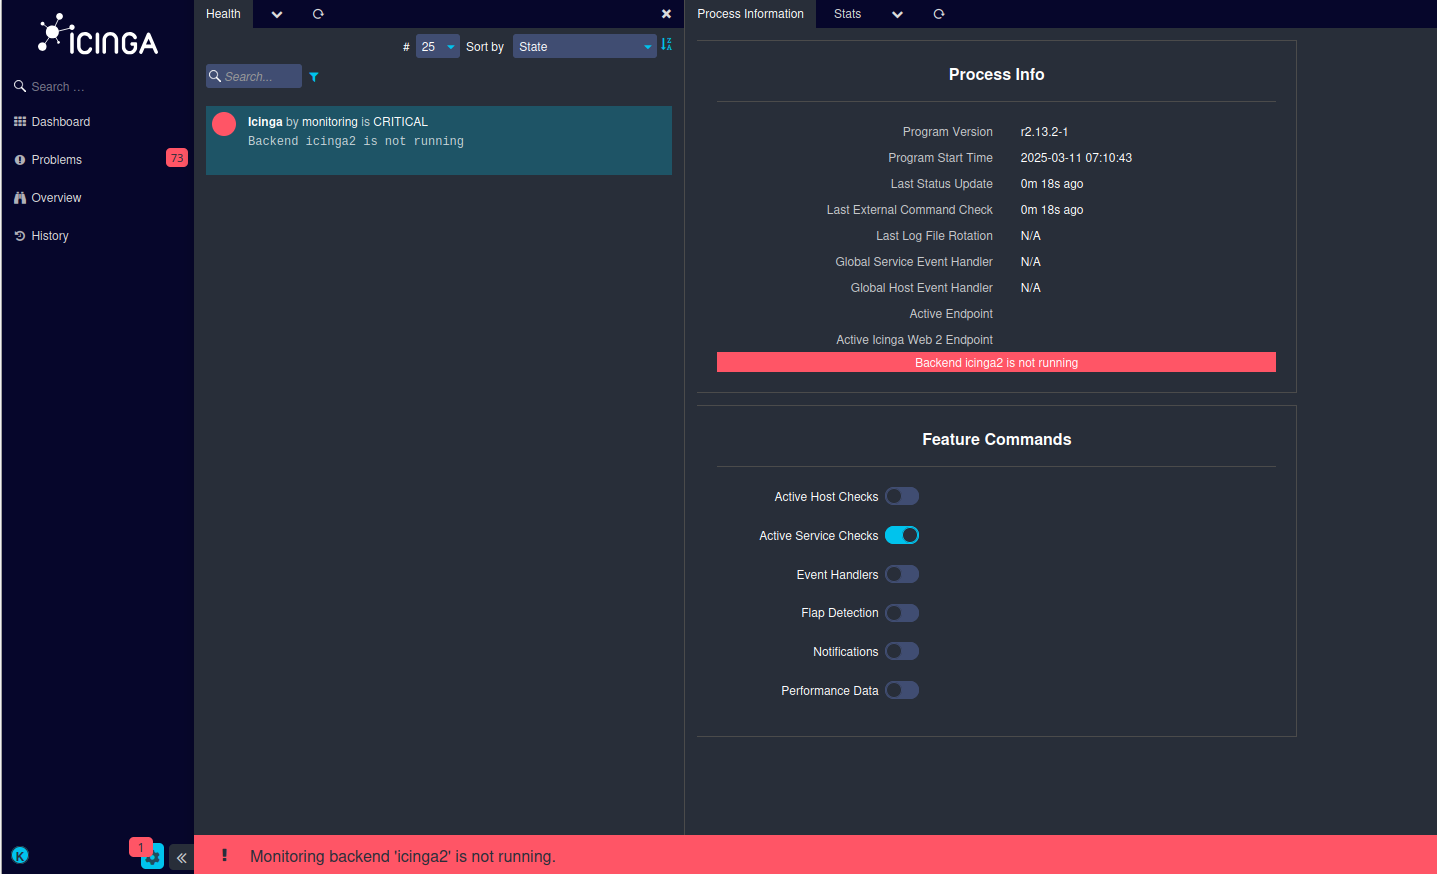
Note: The feature commands were disabled on purpose during the upgrade maintenance
But I was actually surprised to see this kind of error, since the Icinga2 backend was working correctly. Icinga2 service was started and running on two master nodes (this is a clustered Icinga2 setup).
root@master2:~# systemctl status icinga2
- icinga2.service - Icinga host/service/network monitoring system
Loaded: loaded (/lib/systemd/system/icinga2.service; enabled; vendor preset: enabled)
Drop-In: /etc/systemd/system/icinga2.service.d
|-limits.conf
Active: active (running) since Tue 2025-03-11 07:10:42 CET; 21min ago
Process: 140 ExecStartPre=/usr/lib/icinga2/prepare-dirs /etc/default/icinga2 (code=exited, status=0/SUCCESS)
Main PID: 172 (icinga2)
Status: "Startup finished."
Tasks: 358
Memory: 1.1G
A restart of Icinga2 on one of the master servers also showed no errors in the startup log:
root@master2:~# systemctl restart icinga2
Network connectivity between the Icingaweb2 UI to the backend's API (tcp/5665) and the IDO (MySQL) showed no issues, either.
What's going on?!
And important hint concerning the "backend is not running" error, can be found in the Icinga2 community. When using the IDO (which was the standard until IcingaDB came around), Icinga2 writes a statup update into the database:
MariaDB [(none)]> use icinga
MariaDB [icinga]> select status_update_time from icinga_programstatus;
+---------------------+
| status_update_time |
+---------------------+
| 2025-03-11 07:20:56 |
+---------------------+
1 row in set (0.000 sec)
Hmm... This entry should be more or less up to date with the current time. However I quickly realized that the time on the physical server lags behind (roughly 7mins) from the reality (and from the other master server in the cluster).
I was surprised to see the server lagging behind in time, as I was pretty sure NTP (or systemd-timesyncd) should be installed. Let's check the NTP service:
root@master2:~# systemctl status ntp
- ntp.service - Network Time Service
Loaded: loaded (/lib/systemd/system/ntp.service; enabled; vendor preset: enabled)
Active: active (running) since Tue 2025-03-11 07:05:00 CET; 17min ago
Docs: man:ntpd(8)
Main PID: 4689 (ntpd)
Tasks: 2 (limit: 154068)
Memory: 2.5M
CPU: 141ms
CGroup: /system.slice/ntp.service
|-4689 /usr/sbin/ntpd -p /var/run/ntpd.pid -g -u 118:123
[...]
Service is up and running... But why is the time not in sync?
Let's check the offsets compated to the NTP servers or pools:
root@master2:~# ntpq -p
remote refid st t when poll reach delay offset jitter
==============================================================================
0.ubuntu.pool.n .POOL. 16 p - 64 0 0.000 +0.000 0.000
1.ubuntu.pool.n .POOL. 16 p - 64 0 0.000 +0.000 0.000
2.ubuntu.pool.n .POOL. 16 p - 64 0 0.000 +0.000 0.000
3.ubuntu.pool.n .POOL. 16 p - 64 0 0.000 +0.000 0.000
ntp.ubuntu.com .POOL. 16 p - 64 0 0.000 +0.000 0.000
Ouch, that output doesn't look good. Instead of POOL the refid column should show the IP of the NTP reference server.
After a quick internal research it turns out that the firewall rules for this physical server was adjusted a few months ago - cutting NTP to the Internet. The physical server reboot seems to have triggered the time delay.
Luckily there are internal NTP servers available in that particular network. After I added them into /etc/ntp.conf (just above the pool entries), the time could be synced again:
root@master2:~# grep server /etc/ntp.conf
# Specify one or more NTP servers.
# Use servers from the NTP Pool Project. Approved by Ubuntu Technical Board
server ntp1.example.local iburst
server ntp2.example.local iburst
# Use Ubuntu's ntp server as a fallback.
# Note that "restrict" applies to both servers and clients, so a configuration
# up blocking replies from your own upstream servers.
# Local users may interrogate the ntp server more closely.
root@master2:~# systemctl restart ntp
root@master2:~# ntpq -p
remote refid st t when poll reach delay offset jitter
==============================================================================
0.ubuntu.pool.n .POOL. 16 p - 64 0 0.000 +0.000 0.000
1.ubuntu.pool.n .POOL. 16 p - 64 0 0.000 +0.000 0.000
2.ubuntu.pool.n .POOL. 16 p - 64 0 0.000 +0.000 0.000
3.ubuntu.pool.n .POOL. 16 p - 64 0 0.000 +0.000 0.000
ntp.ubuntu.com .POOL. 16 p - 64 0 0.000 +0.000 0.000
ntp1.example.lo .STEP. 16 u 609 64 0 0.000 +0.000 0.000
*ntp2.example.lo 10.10.101.20 3 u 2 64 1 1.543 -0.128 0.473
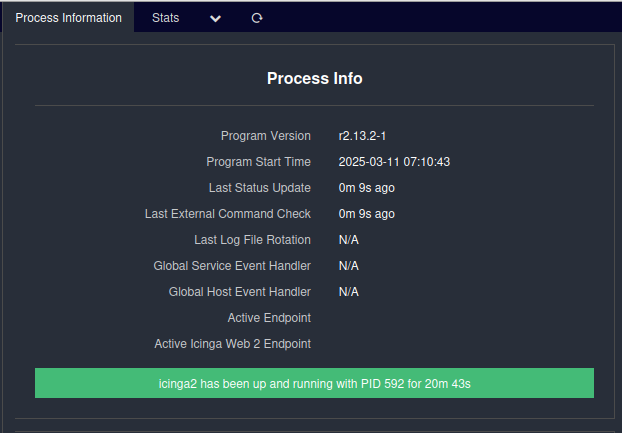
Now that the system time is in sync with the reality again, the status in Icingaweb2 UI changed immediately and the errors disappeared:
No comments yet.

AWS Android Ansible Apache Apple Atlassian BSD Backup Bash Bluecoat CMS Chef Cloud Coding Consul Containers CouchDB DB DNS Databases Docker ELK Elasticsearch Filebeat FreeBSD Galera Git GlusterFS Grafana Graphics HAProxy HTML Hacks Hardware Icinga Influx Internet Java KVM Kibana Kodi Kubernetes LVM LXC Linux Logstash Mac Macintosh Mail MariaDB Minio MongoDB Monitoring Multimedia MySQL NFS Nagios Network Nginx OSSEC OTRS Observability Office OpenSearch PHP Perl Personal PostgreSQL PowerDNS Proxmox Proxy Python Rancher Rant Redis Roundcube SSL Samba Seafile Security Shell SmartOS Solaris Surveillance Systemd TLS Tomcat Ubuntu Unix VMware Varnish Virtualization Windows Wireless Wordpress Wyse ZFS Znuny Zoneminder